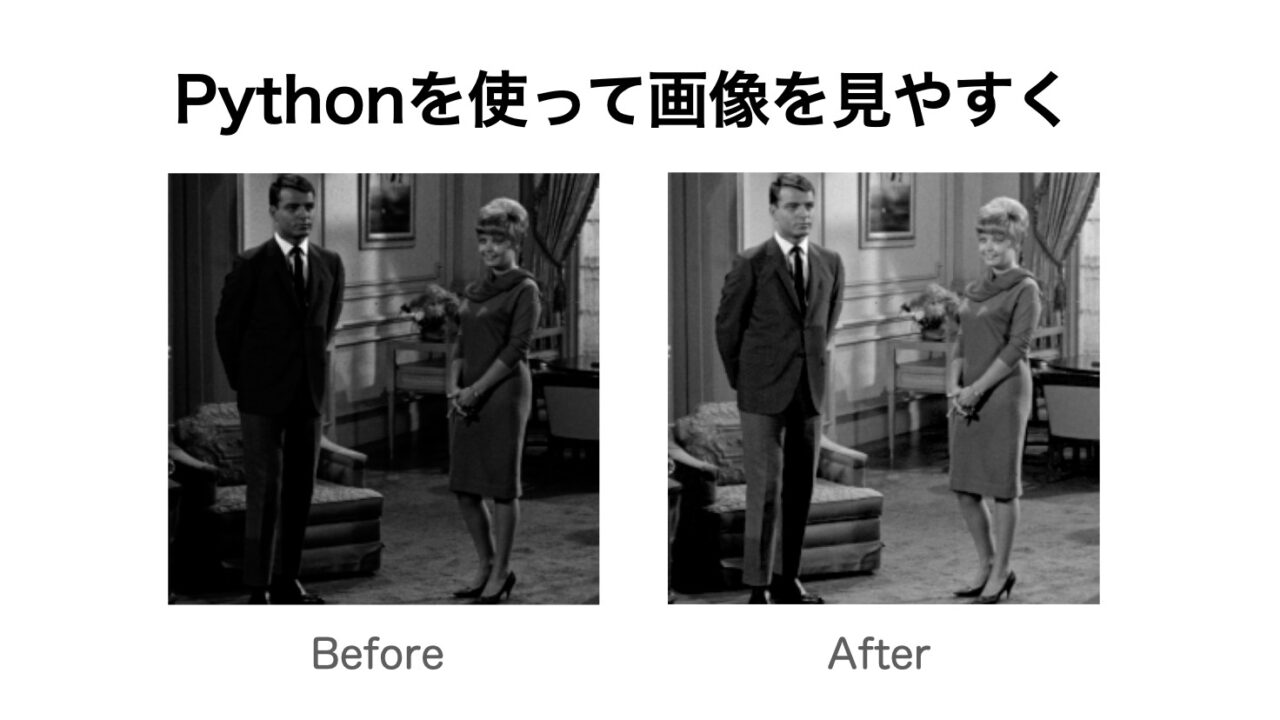
会社では普段画像を取り扱っているのですが、
現場の人に見せるための写真、特に作業中に確認するような写真に関してはちょっとでも綺麗にしてます。
この画像を綺麗にするPythonコードを用意しておくと、画像も素早く編集できるため非常に重宝しております。
今回は明るさ・コンストラクトをトーンカーブ使って変換する方法について書いていきます。
まえおき
今回も神奈川工科大学さんのwebサイトから標準画像データベースSIDBAを使わせてもらいました。
またヒストグラムなどの統計量の知識も必要になっておりますので
ぜひ前回の記事で統計量については、前回の記事にて確認していただければと思います。
トーンカーブとは
白黒画像は各ピクセルに0(黒)~255(白)の画素値が入っております。
なので画像の濃淡を変換させるには、関数を使ってその画素値を変換させます。
この関数を階調変換関数といい、グラフで表したものをトーンカーブといいます。
このトーンカーブに元の画像を入力して、画像を見やすくしたりします。
折れ線型トーンカーブ
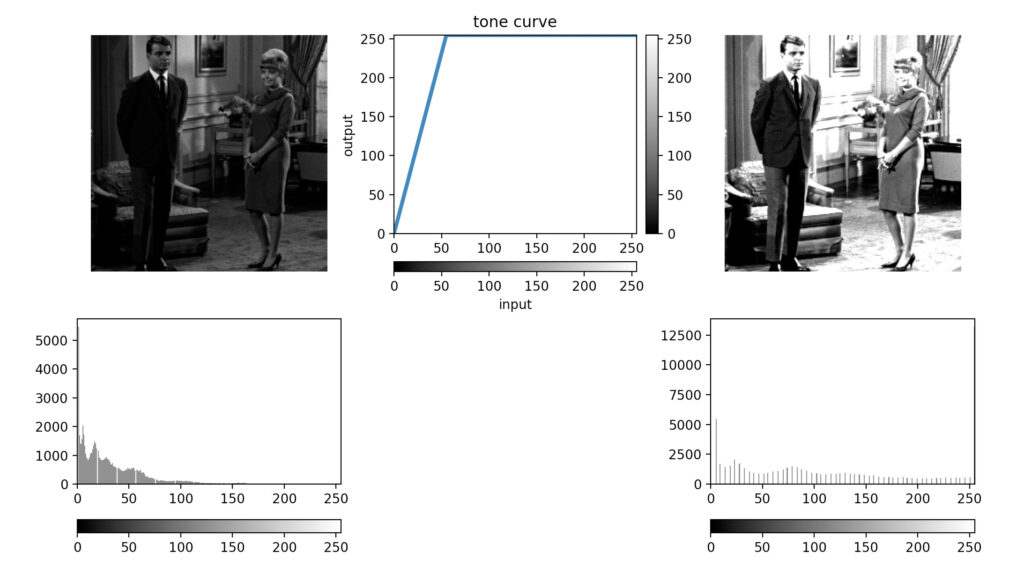
上の画像がその例です。左側が元の画像・真ん中がトーンカーブの関数・右側が変換後の画像になります。
画像全体が明るくなり、椅子の部分だったり服のデザインが見えやすくなったと思います。
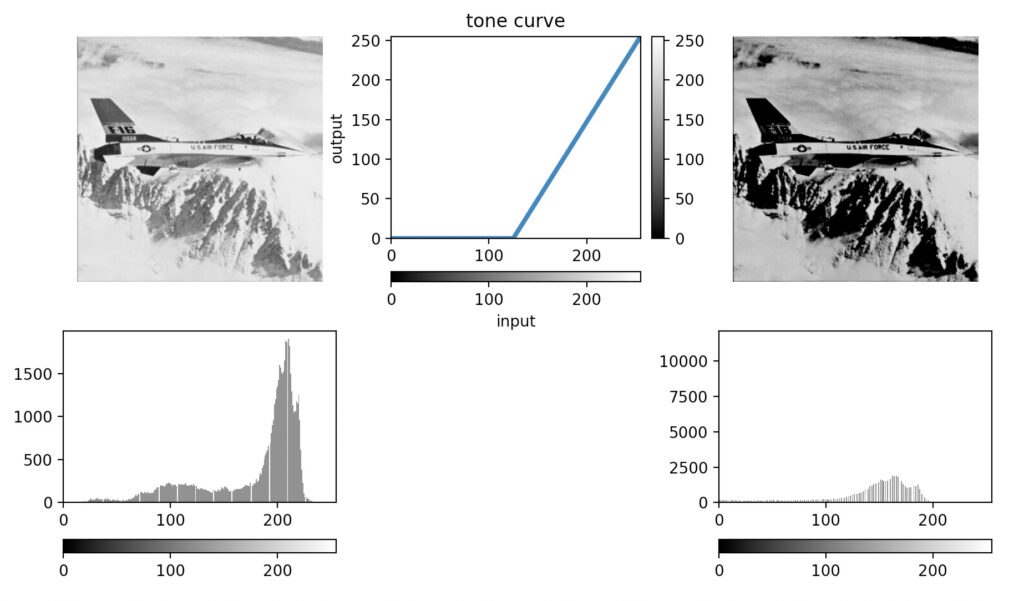
また、元の画像のヒストグラムをみると、トーンカーブの傾きが1より大きいところに収まっているため
よりくっきり飛行機が見えると思います。
この時のPythonのコードが以下の感じ
from PIL import Image
import numpy as np
import matplotlib as mpl
import matplotlib.pyplot as plt
import math
from matplotlib.colors import Normalize
from mpl_toolkits.axes_grid1 import make_axes_locatable
#トーンカーブの関数
def f(x):
if x<= 55:
y = (255/55)*x
else:
y=255
return y
#真ん中のグラフ用の描画
x_graph = list(range(256))
y_graph = [f(n) for n in x_graph]
#画像の各ピクセルの値を変換するようにする処理
vs_f = np.vectorize(f)
#画像の読み込み
im = np.array(Image.open('couple(BW).bmp'))
print('画像の大きさ', im.shape)
im_flat = im.flatten()
print('一次元配列に変換', im_flat.shape)
#グラフの描画
fig = plt.figure()
ax1 = fig.add_subplot(231)
ax2 = fig.add_subplot(234)
ax3 = fig.add_subplot(232)
ax4 = fig.add_subplot(233)
ax5 = fig.add_subplot(236)
#変換前の画像
ax1.axis("off")
ax1.imshow(im, cmap = "gray")
ax2.hist(im_flat, bins = 255, color="gray")
norm = mpl.colors.Normalize(vmin=0, vmax=255)
ax2.set_xlim(0,255)
#トーンカーブ
ax3.plot(x_graph, y_graph, lw=3)
ax3.set_xlim(0,255)
ax3.set_ylim(0,255)
ax3.set_title('tone curve')
ax3.set_ylabel('output')
#カラーバーもしっかり描きますよ
fig.colorbar(mpl.cm.ScalarMappable(norm=norm, cmap="binary_r"), ax=ax2, orientation='horizontal')
divider = make_axes_locatable(ax3)
cax = divider.append_axes("bottom", size="5%", pad=0.3)
cax2 = divider.append_axes("right", size="5%", pad=0.1) #カラーバーを下に表示
fig.colorbar(mpl.cm.ScalarMappable(norm=norm, cmap="binary_r"), cax=cax, ax=ax3, orientation='horizontal').set_label('input')
fig.colorbar(mpl.cm.ScalarMappable(norm=norm, cmap="binary_r"), cax=cax2, ax=ax3)
#元の画像をトーンカーブに入力する
im_flat2 = vs_f(im_flat)
im_2 = im_flat2.reshape(im.shape[0], im.shape )
#変換後の画像を描画
ax4.axis("off")
ax4.imshow(im_2, cmap = "gray")
ax5.hist(im_flat2, bins = 255, color="gray")
ax5.set_xlim(0,255)
fig.colorbar(mpl.cm.ScalarMappable(norm=norm, cmap="binary_r"), ax=ax5, orientation='horizontal')
plt.show()
plt.close()
########2枚目########
#トーンカーブの関数
def f(x):
if x<= 125:
y = 0
else:
y= (255/130)*(x-125)
return y
x_graph = list(range(256))
y_graph = [f(n) for n in x_graph]
vs_f = np.vectorize(f)
im = np.array(Image.open('Airplane.bmp'))
print('画像の大きさ', im.shape)
im_flat = im.flatten()
print('一次元配列に変換', im_flat.shape)
fig = plt.figure()
ax1 = fig.add_subplot(231)
ax2 = fig.add_subplot(234)
ax3 = fig.add_subplot(232)
ax4 = fig.add_subplot(233)
ax5 = fig.add_subplot(236)
#変換前の画像
ax1.axis("off")
ax1.imshow(im, cmap = "gray")
ax2.hist(im_flat, bins = 255, color="gray")
norm = mpl.colors.Normalize(vmin=0, vmax=255)
ax2.set_xlim(0,255)
#トーンカーブ
ax3.plot(x_graph, y_graph, lw=3)
ax3.set_xlim(0,255)
ax3.set_ylim(0,255)
ax3.set_title('tone curve')
ax3.set_ylabel('output')
fig.colorbar(mpl.cm.ScalarMappable(norm=norm, cmap="binary_r"), ax=ax2, orientation='horizontal')
divider = make_axes_locatable(ax3)
cax = divider.append_axes("bottom", size="5%", pad=0.3)
cax2 = divider.append_axes("right", size="5%", pad=0.1) #カラーバーを下に表示
fig.colorbar(mpl.cm.ScalarMappable(norm=norm, cmap="binary_r"), cax=cax, ax=ax3, orientation='horizontal').set_label('input')
fig.colorbar(mpl.cm.ScalarMappable(norm=norm, cmap="binary_r"), cax=cax2, ax=ax3)
im_flat2 = vs_f(im_flat)
im_2 = im_flat2.reshape(im.shape[0], im.shape
 )
#変換後の画像
ax4.axis("off")
ax4.imshow(im_2, cmap = "gray")
ax5.hist(im_flat2, bins = 255, color="gray")
ax5.set_xlim(0,255)
fig.colorbar(mpl.cm.ScalarMappable(norm=norm, cmap="binary_r"), ax=ax5, orientation='horizontal')
plt.show()
plt.close()
)
#変換後の画像
ax4.axis("off")
ax4.imshow(im_2, cmap = "gray")
ax5.hist(im_flat2, bins = 255, color="gray")
ax5.set_xlim(0,255)
fig.colorbar(mpl.cm.ScalarMappable(norm=norm, cmap="binary_r"), ax=ax5, orientation='horizontal')
plt.show()
plt.close()上が書いたコードになります。
変換よりもこのPythonのmatplotlibの描画の調整が実はすごく大変で
特にcolorbarの値と大きさをトーンカーブのグラフの横縦軸と合わせるのが大変でした。
そのあたりは
divider = make_axes_locatable(ax3)
cax = divider.append_axes(“bottom”, size=”5%”, pad=0.3)
fig.colorbar(mpl.cm.ScalarMappable(norm=norm, cmap=”binary_r”), cax=cax, ax=ax3, orientation=’horizontal’).set_label(‘input’)
で無理やり合わせ込みました。
この記事でカラーバーの調整についても書いておりますので、是非参考にしてください。
累積型・S字型トーンカーブ
折れ線型のトーンカーブはシンプルに効果が分かるんですけど、トーンカーブが定数になってる部分は
同じ画素になってしまうため、塗りつぶしになってしまいます。
そのため曲線のトーンカーブもよく使われます。
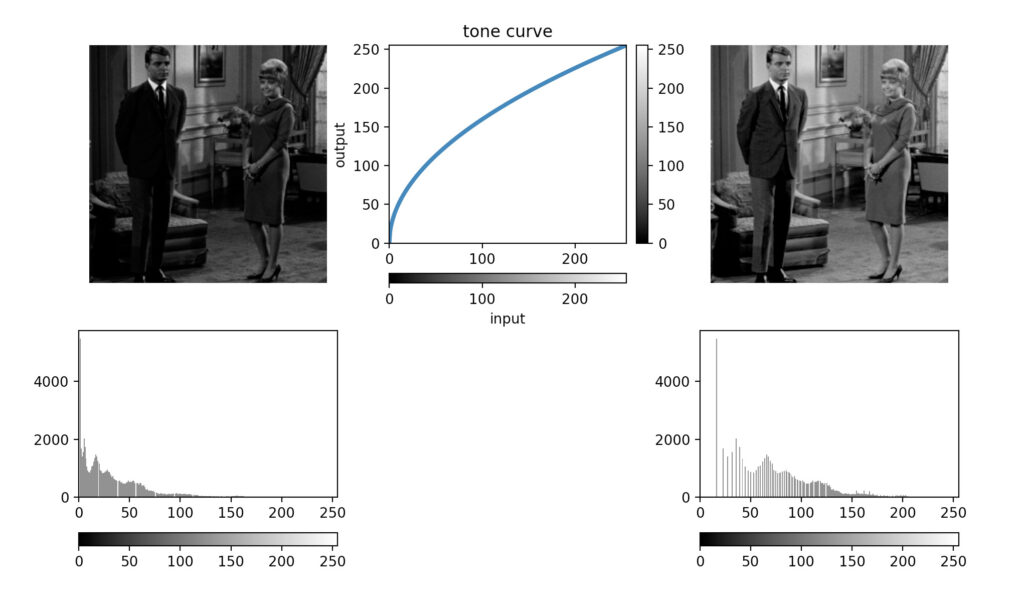
まず上の例が累積型トーンカーブによる変換です。
折れ線型と同じように、黒い部分を明るくすると同時に、壁に差し込んだ影の様子もしっかり残っていて、
より画像が見やすくなったと思います。
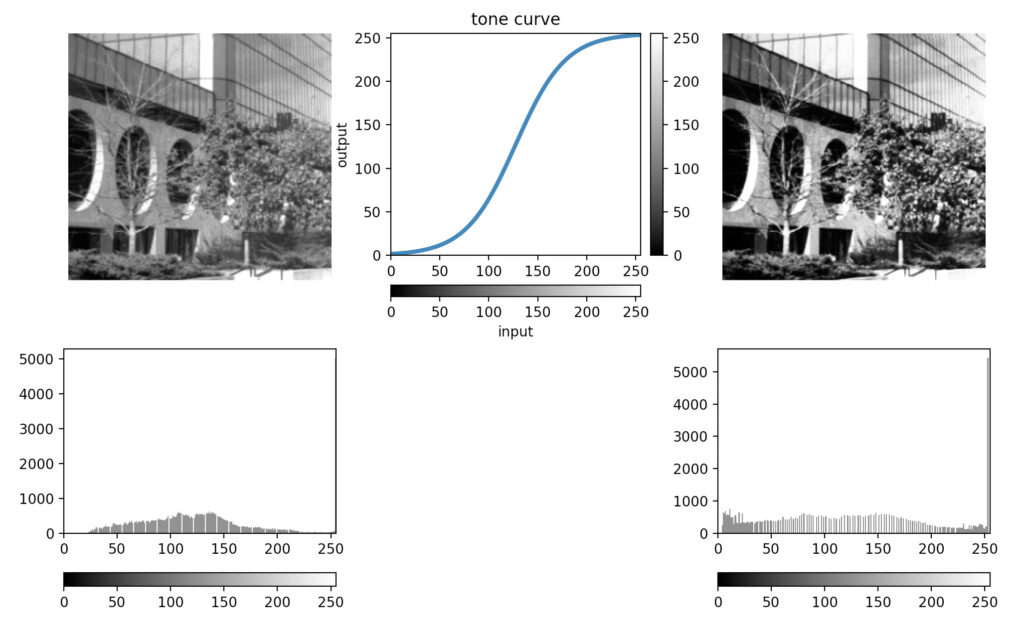
次はS字型のトーンカーブによる変換です。
元の画像はヒストグラムが中央に多めの画像なのですが、変換後は中央のヒストグラムが引き伸ばされて
明暗がくっきりしたと思います。
このS字型のトーンカーブは今回シグモイド関数と呼ばれる、機械学習の活性化関数でも使われてる関数を使いました。
コードはこちら
from PIL import Image
import numpy as np
import matplotlib as mpl
import matplotlib.pyplot as plt
import math
from matplotlib.colors import Normalize
from mpl_toolkits.axes_grid1 import make_axes_locatable
#累積型のトーンカーブ
def f(x):
y = 255*(x/255)**(1/2)
return y
x_graph = list(range(256))
y_graph = [f(n) for n in x_graph]
vs_f = np.vectorize(f)
im = np.array(Image.open('couple(BW).bmp'))
print('画像の大きさ', im.shape)
im_flat = im.flatten()
print('一次元配列に変換', im_flat.shape)
fig = plt.figure()
ax1 = fig.add_subplot(231)
ax2 = fig.add_subplot(234)
ax3 = fig.add_subplot(232)
ax4 = fig.add_subplot(233)
ax5 = fig.add_subplot(236)
#変換前の画像
ax1.axis("off")
ax1.imshow(im, cmap = "gray")
ax2.hist(im_flat, bins = 255, color="gray")
norm = mpl.colors.Normalize(vmin=0, vmax=255)
ax2.set_xlim(0,255)
#トーンカーブ
ax3.plot(x_graph, y_graph, lw=3)
ax3.set_xlim(0,255)
ax3.set_ylim(0,255)
ax3.set_title('tone curve')
ax3.set_ylabel('output')
fig.colorbar(mpl.cm.ScalarMappable(norm=norm, cmap="binary_r"), ax=ax2, orientation='horizontal')
divider = make_axes_locatable(ax3)
cax = divider.append_axes("bottom", size="5%", pad=0.3)
cax2 = divider.append_axes("right", size="5%", pad=0.1) #カラーバーを下に表示
fig.colorbar(mpl.cm.ScalarMappable(norm=norm, cmap="binary_r"), cax=cax, ax=ax3, orientation='horizontal').set_label('input')
fig.colorbar(mpl.cm.ScalarMappable(norm=norm, cmap="binary_r"), cax=cax2, ax=ax3)
im_flat2 = vs_f(im_flat)
im_2 = im_flat2.reshape(im.shape[0], im.shape )
#変換後の画像
ax4.axis("off")
ax4.imshow(im_2, cmap = "gray")
ax5.hist(im_flat2, bins = 255, color="gray")
ax5.set_xlim(0,255)
fig.colorbar(mpl.cm.ScalarMappable(norm=norm, cmap="binary_r"), ax=ax5, orientation='horizontal')
plt.show()
plt.close()
########2枚目########
#S字型のトーンカーブ
def f(x):
x_c = (x-(255/2))/(255/2)
y = (1 / (1 + math.exp((-1)*5* x_c)))*255
return y
x_graph = list(range(256))
y_graph = [f(n) for n in x_graph]
vs_f = np.vectorize(f)
im = np.array(Image.open('Building.bmp'))
print('画像の大きさ', im.shape)
im_flat = im.flatten()
print('一次元配列に変換', im_flat.shape)
fig = plt.figure()
ax1 = fig.add_subplot(231)
ax2 = fig.add_subplot(234)
ax3 = fig.add_subplot(232)
ax4 = fig.add_subplot(233)
ax5 = fig.add_subplot(236)
#変換前の画像
ax1.axis("off")
ax1.imshow(im, cmap = "gray")
ax2.hist(im_flat, bins = 255, color="gray")
norm = mpl.colors.Normalize(vmin=0, vmax=255)
ax2.set_xlim(0,255)
#トーンカーブ
ax3.plot(x_graph, y_graph, lw=3)
ax3.set_xlim(0,255)
ax3.set_ylim(0,255)
ax3.set_title('tone curve')
ax3.set_ylabel('output')
fig.colorbar(mpl.cm.ScalarMappable(norm=norm, cmap="binary_r"), ax=ax2, orientation='horizontal')
divider = make_axes_locatable(ax3)
cax = divider.append_axes("bottom", size="5%", pad=0.3)
cax2 = divider.append_axes("right", size="5%", pad=0.1) #カラーバーを下に表示
fig.colorbar(mpl.cm.ScalarMappable(norm=norm, cmap="binary_r"), cax=cax, ax=ax3, orientation='horizontal').set_label('input')
fig.colorbar(mpl.cm.ScalarMappable(norm=norm, cmap="binary_r"), cax=cax2, ax=ax3)
im_flat2 = vs_f(im_flat)
im_2 = im_flat2.reshape(im.shape[0], im.shape
 )
#変換後の画像
ax4.axis("off")
ax4.imshow(im_2, cmap = "gray")
ax5.hist(im_flat2, bins = 255, color="gray")
ax5.set_xlim(0,255)
fig.colorbar(mpl.cm.ScalarMappable(norm=norm, cmap="binary_r"), ax=ax5, orientation='horizontal')
plt.show()
plt.close()
おわりに
ここまで読んでいただき、ありがとうございました。
今回は文字を全然書かずに、写真とコードばっかり書きました。
コードもあまり解説がなくごめんなさい。
またmatplotlibの記事でまとめて書きたいと思います。
